
Next part of the MPS toolkit: Link S&OP to MPS
I regularly get questions on how the different planning levels link: why do we do S&OP if we don’t “use” it on MPS level? Or, if we do ‘use it’, how can we then link it to the planning run on item level? And how should we close the gap between the MPS and the S&OP plan?
In this post, we discuss the last element of the MPS toolkit, prior to moving to how we can “openly discuss the MPS”: the link between S&OP and MPS.
Before we start, let’s recap
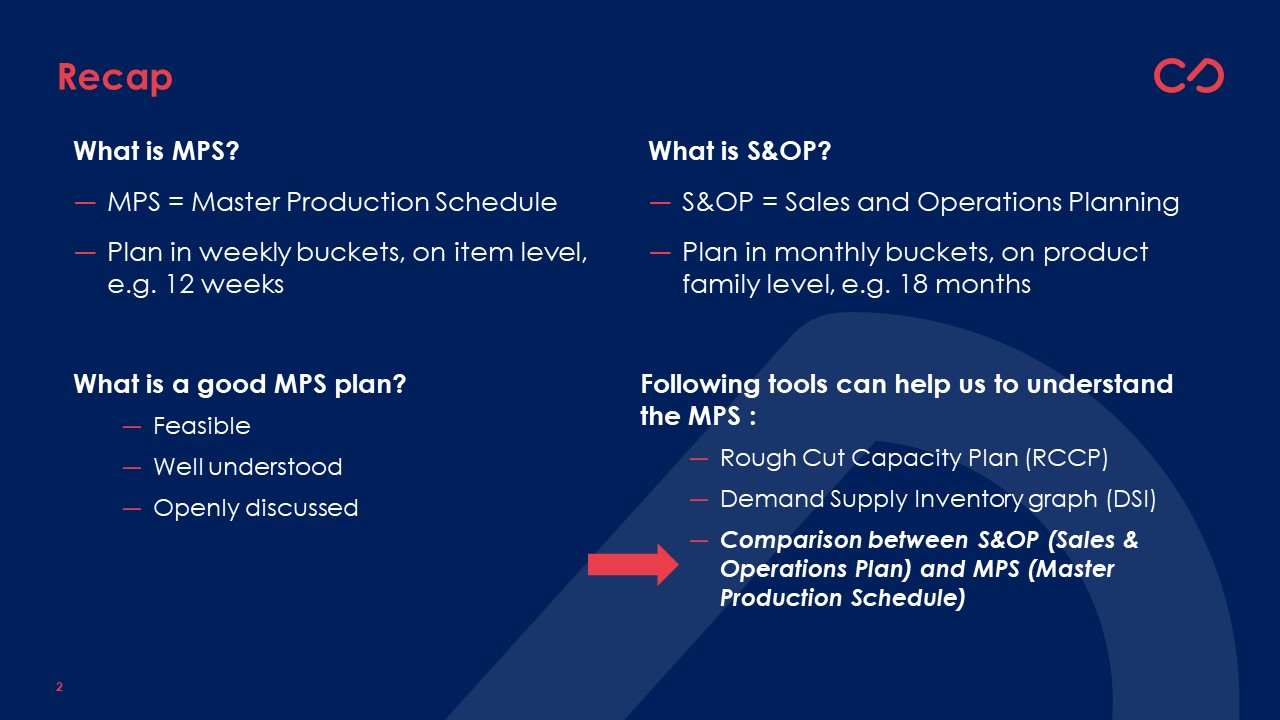
In one of the last blogs, we indicated that the Master Production Schedule is the item-level plan in the upcoming MPS horizon, typically divided in weekly buckets and covering a 12-week horizon.
We also highlighted what we believe characterizes a ‘good Master Production Schedule’. We mentioned it needs to be:
- Feasible
- Well-understood
- Openly discussed
If you want to know more about the above statements, don’t hesitate to refer to the previous blogs. You can find them all on our website www.allics.be.
Introduction to the toolkit
Today, we want to further discuss how to come to a better understanding of the Master Production Schedule! We will introduce you to the last element of the MPS toolkit: the comparison between the MPS and the S&OP plan.
The MPS toolkit consists basically of three elements:
- The Rough Cut Capacity Plan
- The DSI graph (Demand-Supply-Inventory)
- The Comparison of the MPS versus the S&OP
Next to that, there are various KPI’s that you want to measure to support the understanding. We will keep the KPI’s, processes, meeting setups for one of our upcoming blogs.
Summarizing the planning levels
The Master Production Schedule or MPS is the item-level plan that is typically made in the upcoming 3 months, typically in weekly buckets. It differs from:
- The detailed schedule, as this is sequencing the different production orders on the individual machines on a continuous timeline in the frozen horizon (the short term)
- The S&OP plan, as this is planning the volume per product family in monthly buckets
The output of the monthly S&OP cycle
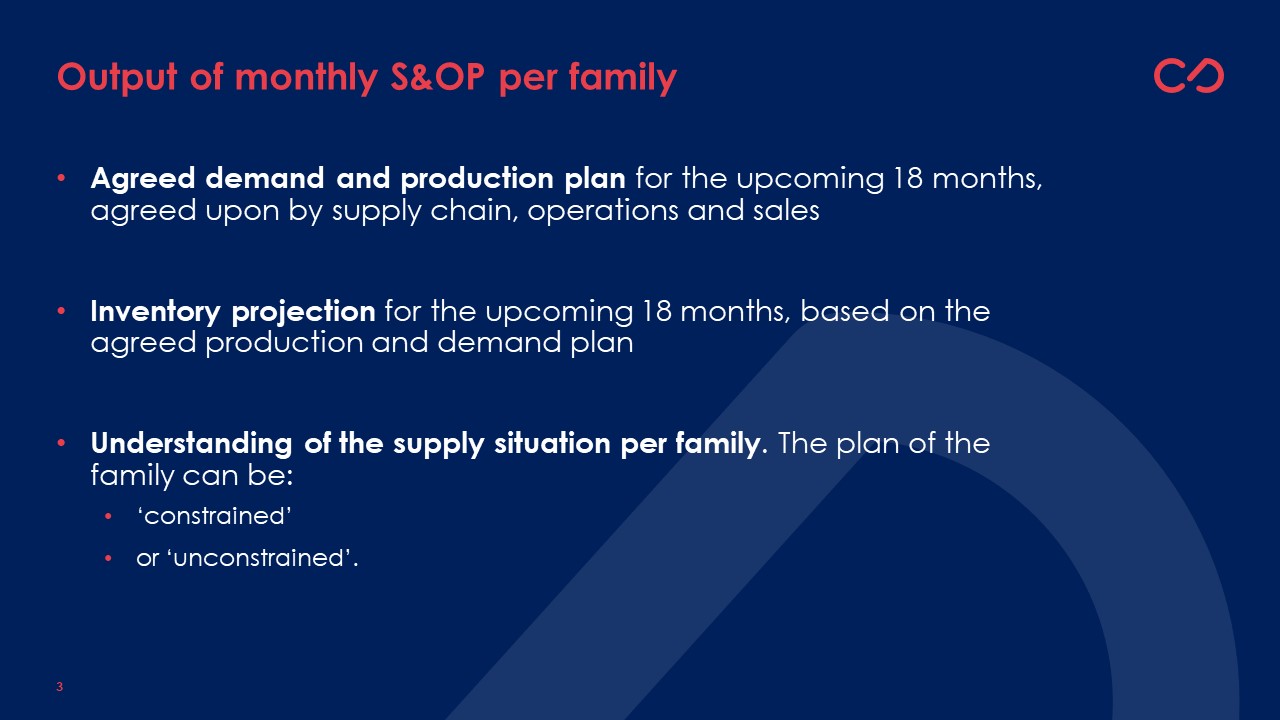
The monthly S&OP cycle typically generates a few outputs:
- An agreed demand and production plan for the upcoming 18 months, agreed upon by supply chain, operations and sales
- An inventory projection for the upcoming 18 months, based on the agreed production and demand plan
- An understanding of the supply situation per family. Either the plan of the family is:
- ‘constrained’
- or the plan is ‘unconstrained’.
It is crucial for both the MPS and the S&OP level that it is fully clear whether and to what extent the S&OP plan for each family is constrained! We need to elaborate a bit further before we can discuss how we should align the MPS to the S&OP plan.
Understanding to which extent the S&OP supply plan is constrained
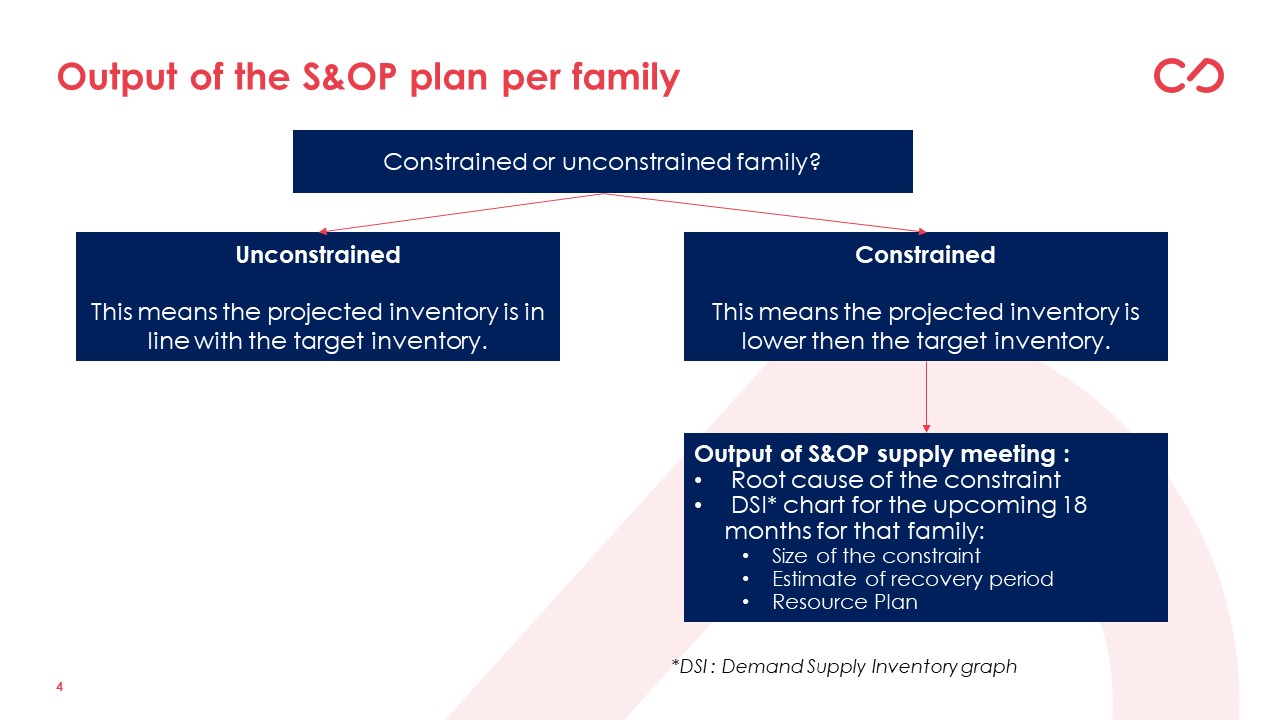
If the S&OP plan is unconstrained, the planned inventories are in line with, or above, the target inventories. In that case, it is important to conclude for this family that the plan is indeed unconstrained. It means that if demand and supply both follow the plan, the inventories are planned to be in line with the desired levels.
If the plan is constrained, the following conclusions need to be agreed upon, typically prior to bringing the conclusions to the monthly S&OP Supply Meeting. These conclusions are typically documented on a one pager per constrained family:
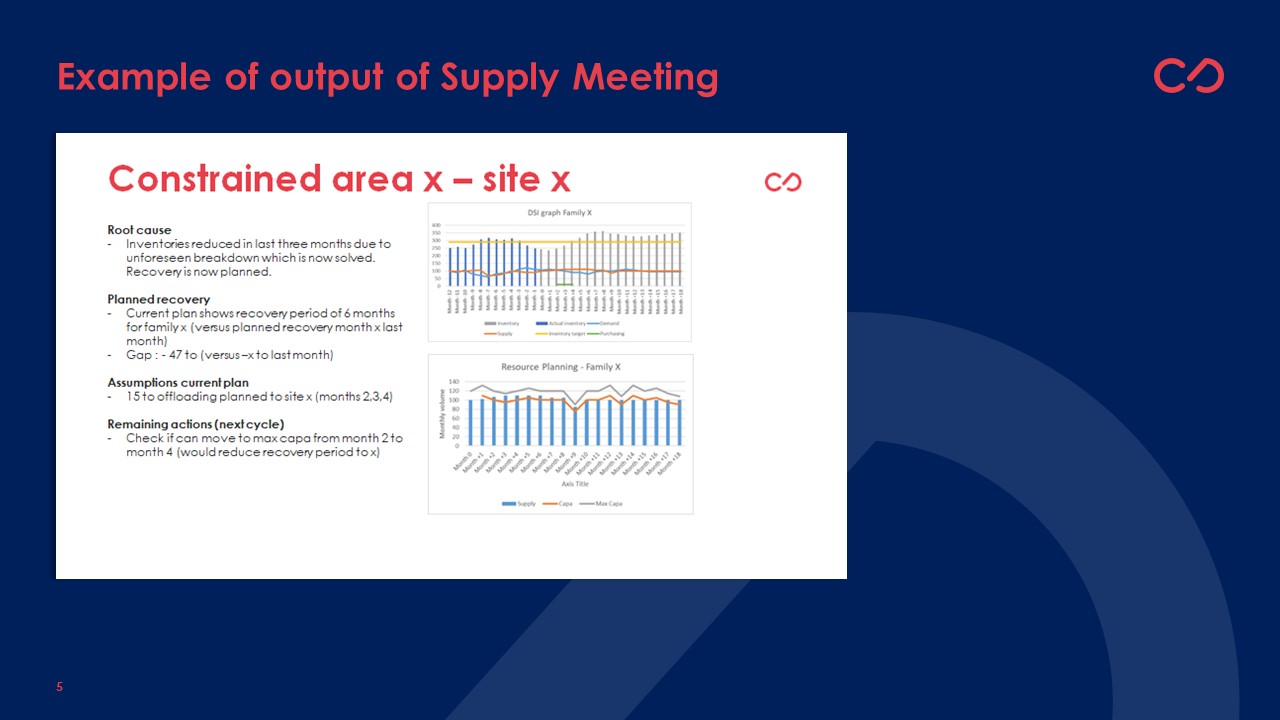
- The root cause of the constraint. What has caused the fact that we are now facing a constrained situation? This could be related to demand changes, supply issues, needs for stock builds due to projects, …
- A DSI (Demand – Supply – Inventory) chart for the upcoming 18 months for that family. This chart shows the planned inventories versus the target inventories. Based on this chart, the following statements are deducted:
- The size of the constraint (the delta between the planned inventory and the target inventory).
- An indication on when the plan is foreseen to become ‘unconstrained’. This moment is equal to the moment where the projected inventory is back in line with the target inventory.
- It typically also shows the Resource Plan, showing the planned load versus the planned capacity line for the family.

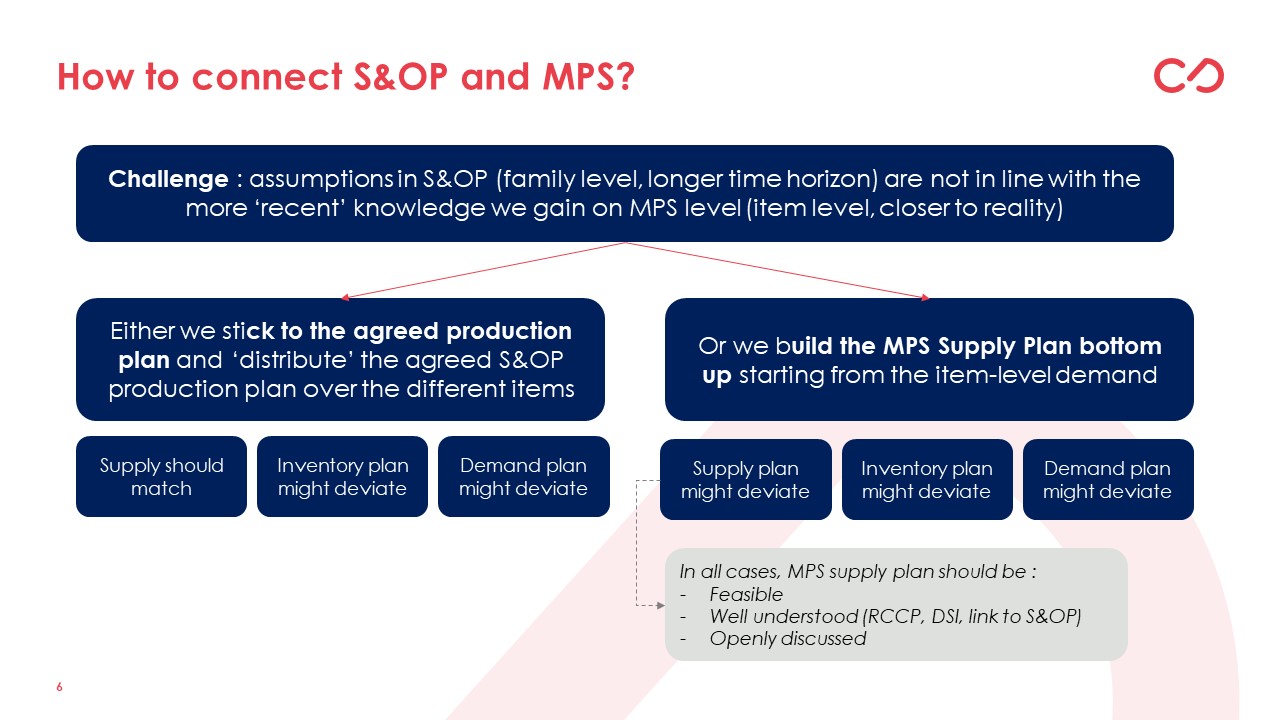
Comparing the S&OP to the MPS
What do we need to compare?
We need to compare the three elements:
- The planned supply
- The planned inventory
- The planned demand
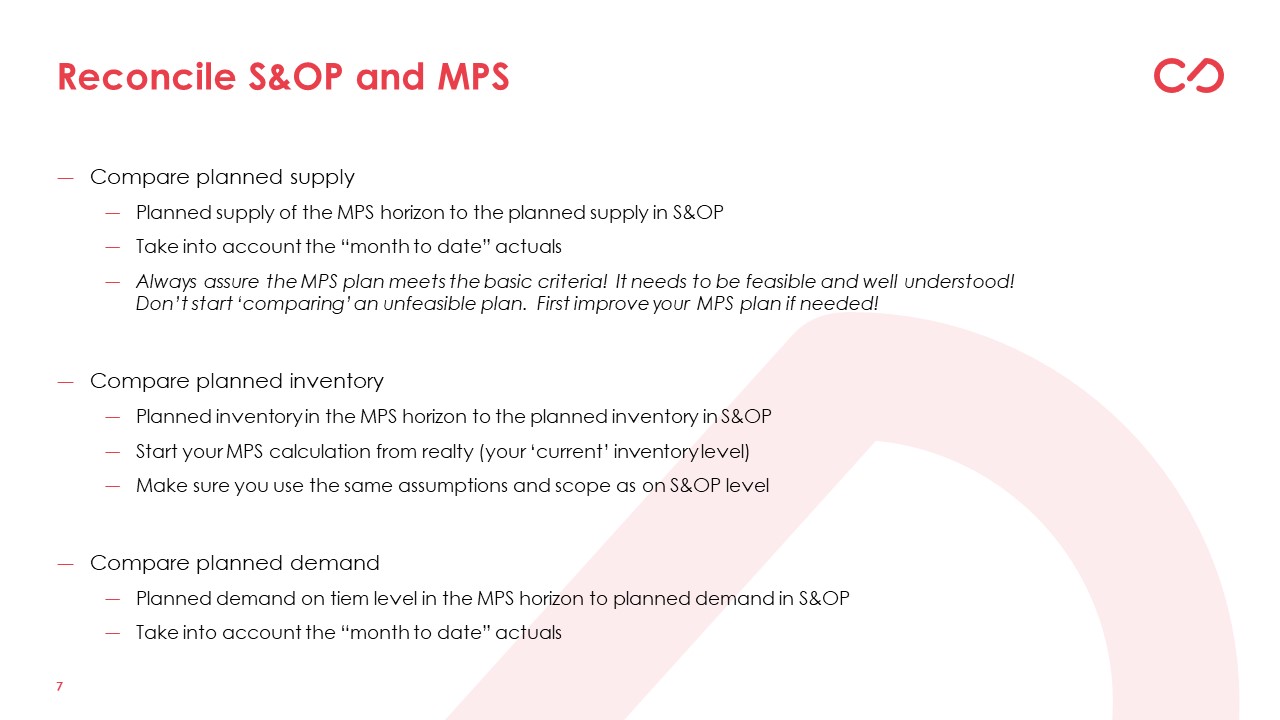
Compare the planned supply
For the ongoing month and the upcoming two months: aggregate the planned supply of the MPS per family and add the already-executed volumes for that family in the current month. Compare it to the agreed production plan of that family in the relevant month.
In some tools and process setups, the S&OP production plan will drive the creation of the MPS plan and will be considered a given. The advantage of that is that there is always a match between the S&OP and the initial MPS plan. The disadvantage is that there might be cases where deviations are actually opportunities. On MPS level, it is important we can still, within boundaries of agreements and possibilities, react to the day to the actual planning situation and include specific events that might be unforeseen.
Compare the planned inventory
For the ongoing month and the upcoming two months: aggregate the planned inventory of the MPS per family at the end of each month and compare it to the S&OP planned inventories.
Compare the planned demand
For the ongoing month and the upcoming two months: aggregate the planned (independent) demand per family in the MPS and add the already-shipped volumes for that family in the current month.
Compare it to the agreed demand plan of that family in the relevant month.
Make an overall conclusion
From these comparisons, you can understand what is happening on MPS level versus your S&OP Plan.
- Is your demand lagging behind or was it underestimated?
- Is your supply plan and execution in line with S&OP?
- What is happening to your planned inventory versus the S&OP inventory projection?
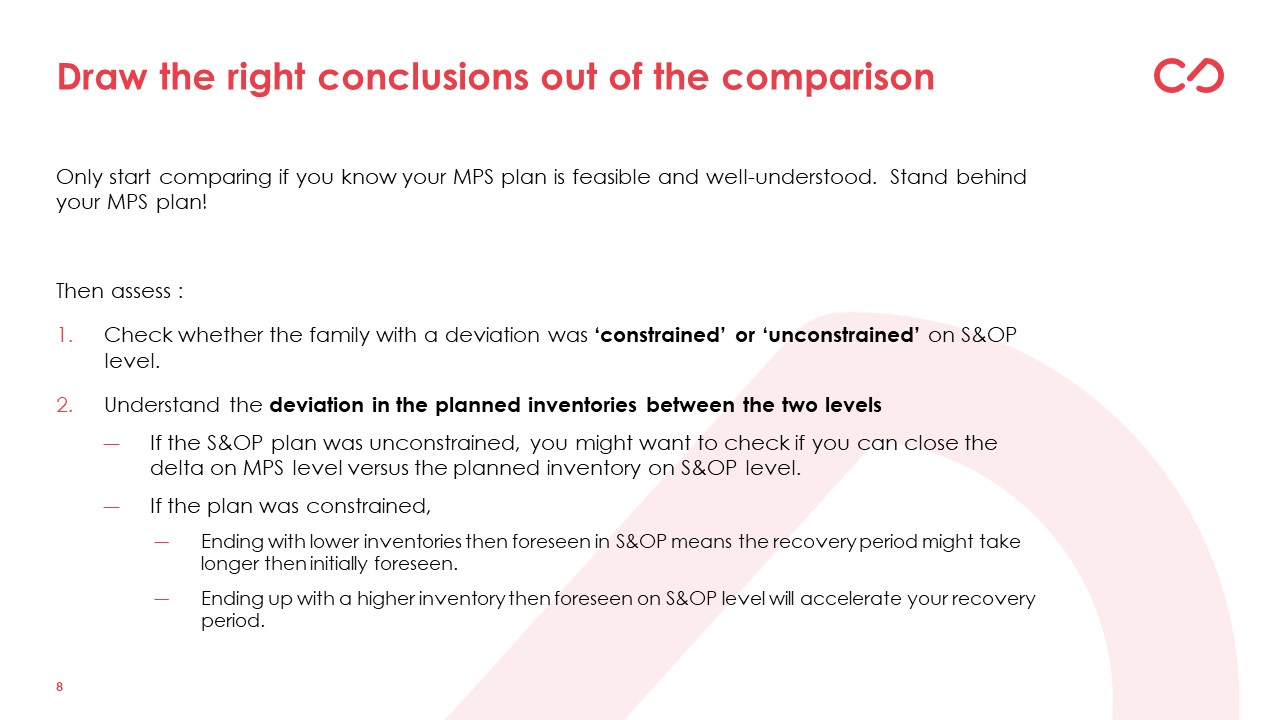
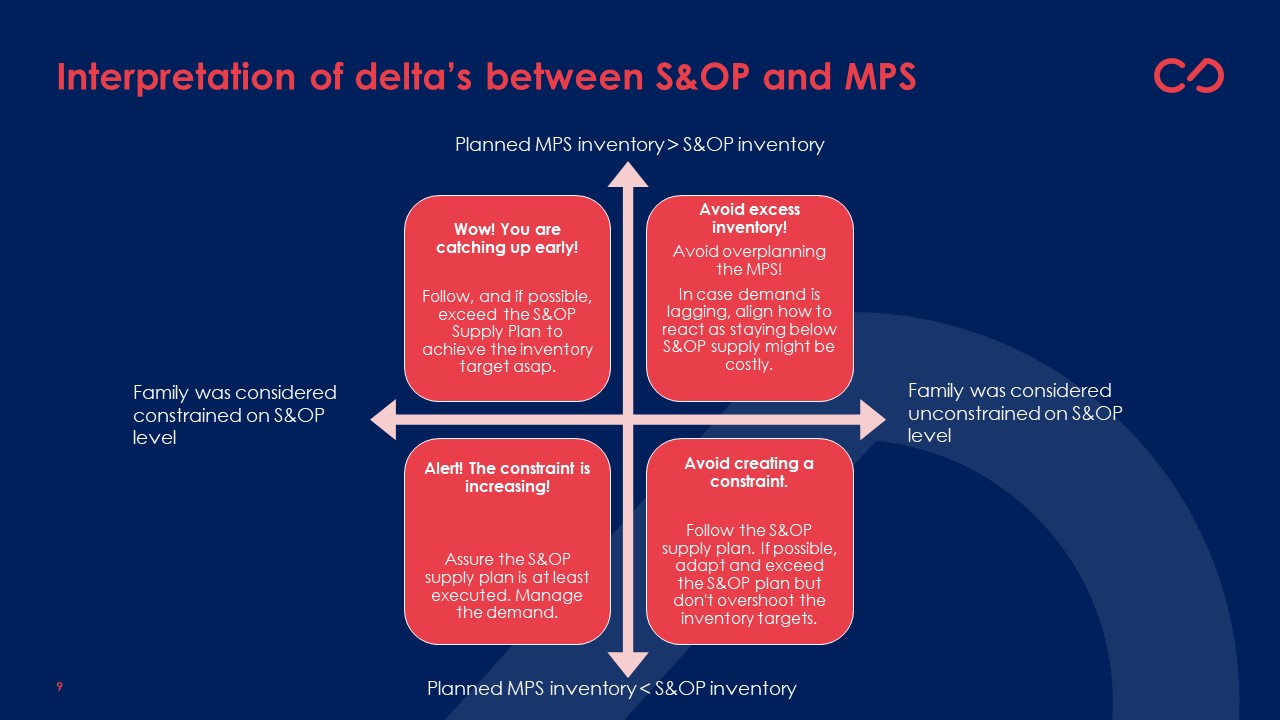
Reacting to the deltas
Typically, there will be deltas between the S&OP and the MPS. The next question is, what actions should be taken for which deltas?
Don’t make it more complicated than needed. 90% of the work has been done by now. You understand your MPS plan and how it might deviate from your S&OP plan. You also have a very clear output from the S&OP process, indicating whether or not your plan was constrained and the size of the possible constraint.
You will typically understand what is causing these deltas. Now, you need to define whether and how to react to those deltas. To be honest, this chapter is only summarizing your own common sense but for completeness, we describe the decision tree below.
